VASP and VMD on CCAST
|
Misc. Tools
|
|
| cd foldername | lets you go into a folder |
| cd .. | Backs you out of folder you are in |
| cd - | Goes back to previous directory |
| cd ~ | Goes to home directory |
| freenodes | in ccast |
| vi filename | Lets you go into file to edit |
| i | When in “vi” this initiates the editing |
| :wq | This lets you stop editing |
| “Ctrl+c” press on keyboard, not a typing thing | Lets you stop any current running process |
| pwd | Gives you current directory location |
| wc | Word count: The 1st number shows number of lines present in file. 2nd number of words present in file. 3rd column shows number of characters present in file. 4th number is the file name which is given as an argument. |
| ls | Lists what is in the current directory |
| ls -lt | Lists what is in the current directory sorting from newest to oldest |
| ls –lt W* | Lists everything that starts with a W sorting from newest to oldest. (Can be used for other letters as well) |
| ls -lisanh | gives information on the files in whole directory |
| ls -lisanh filename | gives information on the specific file |
| ls -lisan | gives information on the files in whole directory |
| ls -lisan filename | gives information on the specific file |
| ls -a | shows all files, including hidden ones |
| babel –ixyz file.xyz –opdb file.pdb xyz to pdb |
Using babel, converts the input file of .xyz to outputfile of .pdb That is where the –ixyz and –opdb comes from |
| “shift+alt+left click” | For slecting just comlumn or just row information you want exactly |
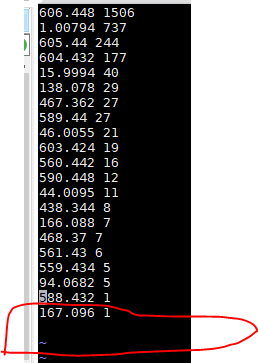
| 166' OS_STRENGTH | grep technique |
| more filename | Lets you see what is in the file |
| more ~/bin/filename | Lets you see the file in a location not in your current directory. |
| grep ### or value | grep again if desired | shows file and grabs lines with same input you put after the grep command |
| cp /Location/filename . | Copies a file from a different directory location and input it into the current directory. Don’t forget the PERIOD! |
| P /Location/filename ./newfilename | Copies a file from a different directory location and input it into the current directory and rename it in one step |
| scp sourceUser:/sourceLocation/filename . | Takes file from different SERVER/ACCOUNT. You must be in the destination directory you want the files to go to when typing this line |
| scp sourceUser:/sourceLocation/* . | Takes ALL files from different SERVER/ACCOUNT. You must be in the destination directory you want the files to go to when typing this line |
| scp sourceUser:/sourceLocation/*.filetype . | Takes ALL files with that specific file type from different SERVER/ACCOUNT. You must be in the destination directory you want the files to go to when typing this line |
| scp * destinationUser:/destinationLocation | Sends all files from source directory to destination directory. Must be in source directory when typing this line |
| scp * username@photon.chem.ndsu.nodak.edu:/scratch001/Chem_476/CHEM676_2019/username/DIMER/DIMabsorptionspec | Example of scp |
| sbatch corifilename | Lets you submit a file in cori using a corifile made by others |
| grep specificdetail filename | Grabs the specific detail from the file you chose |
| sort -n -r filename | sorts the file in ascending order |
| babel BondLength.xyz -O out.xyz --separate | THIS IS CORRECT WAY THE SEP WORD IS SPELLED INCORRECTLY BUT IS CORRECT FOR BABEL |
| awk '{ if($4 >= 4.0000 && $4<=5.0000) print }' OS_STRENGTH1 | lets you get lines of data that contain the range from 4-5 from column 4 |
| users | lets you see what users are on |
| clear | lets you clear screen |
| who | who is on and more detail about them |
| w | all the people and differing details about them |
| id | lets me see what groups I am in |
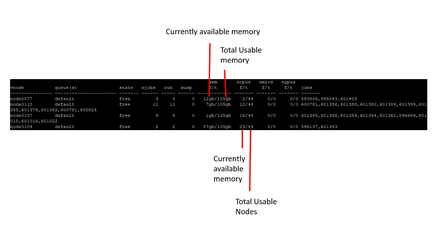
| freenodes | lets you see if nodes are available or not |
|
|
| sort -n | sorts it into order |
| sort –n | more | does this in page format rather than all at once |
| module avail | what software is available |
| $HOME | lets you go to your login directory “home” directory |
|
thunder.ccast.ndsu.edu meade.erickson |
to get into putty |
| C:\Users\meade.erickson\Documents\OriginLab\User Files\ | Origin themes location |
| Explanations | |
| fermi | fermi energy is referring to the energy difference between the highest and lowest occupied single-particle states. (https://en.wikipedia.org/wiki/Fermi_energy) |
| Explanations Input Files: | |
| INCAR | It is the central input file of VASP. It determines "what to do and how to do it". (https://www.vasp.at/wiki/index.php/INCAR) |
| POSCAR | |
| POTCAR | |
| KPOINTS | |
| Explanations Output Files: | |
| CONTCAR |
Contains actual coordinates, velocities, and predictor corrector coordinates. 1st block is lattice parameters and atom coordinates. 2nd block Initial Velocites for atoms. 3rd block Predictor-corrector coordinates. Written at end of each job. Used as the POSCAR file for next MD job. |
| WAVECAR | Provides wavefunctions. we usually use it for spectrum data (https://www.vasp.at/wiki/index.php/WAVECAR) |
| OS_STRENGTH | Information about the OS_STRENGTH |
|
From Wikipedia
| |
| POTIM (in INCAR file) | timestep in femtoseconds. So POTIM=1 is 1 femtosecod |
| Density of States | |
| To get DOS you need to run the correct calculations in VASP using 4 files. INCAR, POSCAR, POTCAR, OUTCAR | |
| Once you get output from your submitted information to cori or photon you can follow these steps to get Density of states | |
| grep NBA OUTCAR | Grabs the number of bands (we need this for later) (STATES) |
| vi input_overlap | editing input_overlap |
| 1 | |
| Number of Bands from the grep NBA OUTCAR line | |
| 1 | |
| “esc” key | |
| :wq | quitting editing input_overlap |
| ~/bin/extract_energy_pop.exe | getting energy pop from different location |
| cp energy_pop STATES | |
| wc STATES | |
| grep NELE OUTCAR | record number of electrons |
| grep NIO OUTCAR | record number of ions |
| grep E-fer OUTCAR | record the three values and their names. If this line doesn’t work the try next line) |
| tail –n 1 | record the three values and their names |
| ~/bin/DRESS_DOS_NORM | Executes the DOS code from different file location |
|
Number of states from grep NBA OUTCAR |
grep NBA OUTCAR line |
| -20 | |
| 20 | |
|
E-fermi info from grep E_fermi
|
To literally line up DOS and STATES, you may need to type in 0 for both fermi and alpha+beta.
|
|
alpha+beta info from grep E_fermi
|
|
| .01 | |
| 1 | |
|
Number of ions from grep NIO OUTCAR
|
|
|
Number of electrons from grep NELE OUTCAR
|
|
| 3 | |
|
gnuplot ~/bin/gnuprog_DOS.fermi
|
Plotting the DOS (This is done in NERSC or PHOTON) |
|
ps2pdfwr DOS.ps
|
Converting DOS file from .ps to .pdf |
set out MEADESDOS.ps MAY NOT NEED THIS NOT SURE YET set style line 4 lw 4 lc -1; unset key; plot [-6:6.6] 'DOS.fermi' using ($1-2.2617):5 w i title "Electron Occupation", 'DOS.fermi' u ($1-2.2617):4 w l title "Dimer Density of States" ls 4; set xlabel 'Orbital Energy, eV' font ",30" offset 0,-2,0; set ylabel 'Density of States' font ",30" offset -1,0,0; set title "Density of States Dimer Molecule" font ",30" offset 0,0.5,0; set tics font ",30"; set ytics offset 0,0,0; set xtics offset -0.4,-1,0; set style line 4 lw 4 lc -1 unset key plot [-6:6.6] 'DOS.fermi' using ($1-2.2617):5 w i title "Electron Occupation", 'DOS.fermi' u ($1-2.2617):4 w l title "Dimer Density of States" ls 4; set xlabel 'Orbital Energy, eV' font ",30" offset 0,-2,0 set ylabel 'Density of States' font ",30" offset -1,0,0 set title "Density of States Dimer Molecule" font ",30" offset 0,0.5,0 set tics font ",30" set ytics offset 0,0,0 set xtics offset -0.4,-1,0 set style line 4 lw 4 lc -1; unset key; plot [-6.1:6.1] 'DOS.fermi' using ($1-0.518567):5 w i lw 2 title "Electron Occupation", 'DOS.fermi' u ($1-0.518567):4 w l title "Dimer Density of States" ls 4; set xlabel 'Orbital Energy, eV' font ",30" offset 0,-2,0; set ylabel 'Density of States' font ",30" offset -1,0,0; set title "Density of States Dimer Molecule" font ",30" offset 0,0.5,0; set tics font ",30"; set ytics offset 0,0,0; set xtics offset -0.4,-1,0; set style line 4 lw 4 lc -1; unset key; plot [-6.1:6.1] 'DOS.fermi' using ($1-0.173350):5 w i lw 2 title "Electron Occupation", 'DOS.fermi' u ($1-0.17335):4 w l title "Wet Monomer Density of States" ls 4; set xlabel 'Orbital Energy, eV' font ",30" offset 0,-2,0; set ylabel 'Density of States' font ",30" offset -1,0,0; set title "Density of States Wet Monomer Molecule" font ",30" offset 0,0.5,0; set tics font ",30"; set ytics offset 0,0,0; set xtics offset -0.4,-1,0; |
I am initially specifying a style that I will be using. In this case chose style 4 and am editing it to what I want. lw stands for linwidth, lc line color, not sure where the library is but lc -1 is black, 0=red I think and find out other through trial and error lw is just multiplyer, so lw 4 is 4 times larger than default. unset key gets rid of key, [#,#] is the range of my x axis graph. ($#-###): $# is the column I want to take data from which is being subtracted by the amount of shift I am giving to the data (we want data to be centered at 0 sometimes and so for DOS we take the middle between the start of non occupied plus the end of occupied and divide by 2 to get our shift. (Notoccupied + occupied)/2 ) and the number after the “:” is the column I am correlating the X and Y axis with. So when we plot stuff we need to specify what is the x and what is the y axis. not sure exactly what the “w i” portion does but it helps us change from points to lines and then is what fills in the red portion of our graph. (The “i” stands for impulses. Add an extra “lw 2’ to increase the line width as shown in green text.) “w l” does the same thing but DOESN”T fill out the the electron density portion. xlabel and y labels are the axis titles and offsets help position them due to the changing sizes of the axes and tics. Tics are the numbers on the Y and x axis so ytics offsets them and xtics does the horizontal axis change. |
|
--OPEN A NEW TAB IN MOBA XTERM-- |
|
| Without logging into the account you should be able to see if you are on your current computer | |
| ls | make sure you are in your computer directory. Usually you will see “DESKTOP” as an option |
| cd DESKTOP | |
| scp sourceUser:/sourceLocation/*.pdf . | This is done while in the desktop directory so on your desktop you will see all the pdf files your just generated in desktop |
| Absorption Spectrum - Transition Energy eV – Wavelength nm | |
|
You need a POSCAR file from a previous calculation. SO if you have done a calculation this process can be followed.
|
|
| create an absorption directory where ever you would like and go into this directory | |
| cp ~/bin/INCAR-gm |
copying INCAR-gm into the directory as long as you are in it MAKE SURE LWAVE= .TRUE.
username@cori07:/global/cfs/cdirs/m1251/vasp/CHEM676/meade/DIMER/TDESMD_112_116/COOL_INTERMED_Mead/absorptionSpec/TEST
ENCUT= 300 IBRION =3 POTIM=0.2 NSW = 30000 ALGO = NORMAL #48 ISMEAR = 0 SIGMA = 0.01 LREAL = A
LWAVE = .TRUE. LCHARG = .FALSE. EDIFF=1E-6 EDIFFG=-0.05 LVTOT = .FALSE.
NELM=40
ISYM=0 NPAR=4
|
| cp filelocation/CONTCAR ./POSCAR | Changing CONTCAR to POSCAR |
| cp filelocation/POTCAR . | |
| cp filelocation/KPOINTS . | |
| mv INCAR-gm INCAR | changing file name from INCAR-gm to INCAR |
| cp ~/bin/cori-regular.sh . | this is our job submission file |
| vi cori-regular.sh | |
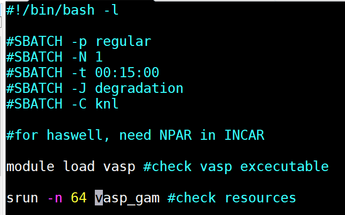
|
Make it Look like this. While in the screen press “I” to insert and edit the file. When done editing it press “:wq” to save and quit the file.
|
| sbatch cori-regular.sh | |
| It is necessary to have the ‘spectrum’ file made which comes from a healthy WAVECAR which is used to generate OS_STRENGTH. After OS_STRENGHT we make the spectrum ~/bin/SPECTRUM_imp3 file. | |
| Assuming you have conducted a calculation which generated a healthy WAVECAR file. | |
| If healthy WAVECAR exists then… | |
| grep NBA OUTCAR | record Number of bands |
| vi input_overlap | |
|
1 Number of Bands 1 |
36740210 |
|
‘esc’ key
|
|
| ~/bin/extract_energy_pop.exe | |
| cp energy_pop STATES | |
| cp ~/bin/OS/2020/*.exe . | |
| module swap PrgEnv-intel PrgEnv-gnu | |
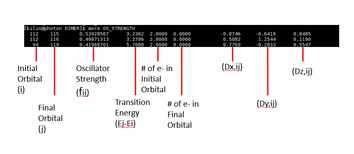
| ./osc_str.exe | This makes the OS_STRENGTH (oscillator strength) |
| grep '2.0000 0.0000' OS_STRENGTH > OS_STRENGTHvc |
Takes the orbital pairs from 2.0000 to 0.0000 into new file.
|
| cp OS_STRENGTH OS_STRENGTH1 | making sure I have original OS_STRENGTH |
| cp OS_STRENGTHvc OS_STRENGTH | making sure I have file OS_STRENGvc kept for 2.0000 – 0.0000 but it will be our OS_STRENGTH |
| wc OS_STRENGTH | Record First number |
| ~/bin/SPECTRUM_imp3 | |
|
Number from OS_STERNEGTH .1 10 .001 HOMO |
Should be able to find HOMO from STATES file (or energy_pop)
|
| a ‘spectrum’ file should have been made. This holds all the spectrum data. The spectrum can be visualized using these commands in Cori. If you want to visualize in photon then use the gnuplot information below | |
| gnuplot ~/bin/gnuprog_SPE |
IN CORI YOU CAN USE THESE THEN SCP them to photon, then the desktop! |
| gnuplot ~/bin/gnuprog_SPE_nm_200_800 | |
| ps2pdfwr SPE.ps | |
| ps2pdfwr SPE_nm.ps | |
| scp * username@photon.chem.ndsu.nodak.edu:/scratch001/Chem_476/CHEM676_2019/Meade/DIMER/TDESMD_112_116/COOL_INTERMED_Mead/absorptionSpec | example make sure you are in the directory of the files you want to send. Send it to a premade directory in photon |
|
--OPEN A NEW TAB IN MOBA XTERM--
|
|
| Without logging into the account you should be able to see if you are on your current computer | |
| ls | make sure you are in your computer directory. Usually you will see “DESKTOP” as an option |
| cd DESKTOP | |
| scp sourceUser:/sourceLocation/*.pdf . | This is done while in the desktop directory so on your desktop you will see all the pdf files your just generated in desktop |
|
FOR PHOTON USE THESE STEPSWe are plotting the information of spectrum to get the spectrum in wavelength of nanometers nm and transition energy in electron volts eV |
|
| more spectrum |
(Be sure to be in correct directory) Column 1 is the spectrum in wavelength of nm column 2 is the spectrum in transition energy of eV column 3 is absorbance/absorption in a.u. (absoption units). Absorbance goes with wavelength, absorption goes with transition energy column 4 idk what this is. |
| gnuplot | |
| plot ‘spectrum’ 2:3 | This gives you transition energy in x axis and absorption in a.u for yaxis. |
| set style line 4 lw 4 lc 3; unset key; plot [0:10] 'spectrum' using 2:3 w l title "Transition Energy" ls 4; set xlabel 'Transition Energy, eV' font ",30" offset 0,-2,0; set ylabel 'absorption a.u' font ",30" offset -1,0,0; set title "Absorption Spectrum Dimer" font ",30" offset 0,0.5,0; set tics font ",30"; set ytics offset 0,0,0; set xtics offset -0.4,-1,0; | This is transition energy in x axis and absorption in yaxis. |
| set style line 4 lw 4 lc 3; unset key; plot [200:800] 'spectrum' using 1:3 w l title "Absorption Spectrum" ls 4; set xlabel 'Wavelength, nm' font ",30" offset 0,-2,0; set ylabel 'absorbance, a.u' font ",30" offset -1,0,0; set title "Absorption Spectrum Dimer" font ",30" offset 0,0.5,0; set tics font ",30"; set ytics offset 0,0,0; set xtics offset -0.4,-1,0; | nm in x axis and absorbance in yaxis |
| UV-Vis Absorption Spectrum | |
|
You need a POSCAR file from a previous calculation. SO if you have done a calculation this process can be followed. We did one calculation already but we need to do a “geometry optimization” for the next one. |
|
| create an absorption directory where ever you would like and go into this directory | |
| cp ~/bin/INCAR-gm | copying INCAR-gm into the directory as long as you are in it |
| cp filelocation/CONTCAR ./POSCAR | Changing CONTCAR to POSCAR |
| cp filelocation/POTCAR . | |
| cp filelocation/KPOINTS . | |
| mv INCAR-gm INCAR | changing file name from INCAR-gm to INCAR |
| cp ~/bin/cori-regular.sh . | this is our job submission file |
| vi cori-regular.sh | |
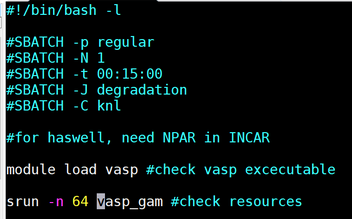
|
Make it Look like this. While in the screen press “I” to insert and edit the file. When done editing it press “:wq” to save and quit the file.
|
| sbatch cori-regular.sh | |
| Generating CANDIDATES file for Photofragmentation | |
| tail –n 700 > STATES1 | Fermi information from OUTCAR into a file called STATES 1. Not sure what the –A or 700 mean. But the tail is choosing a specific section of the data, the “tail” end of the chosen information from the OUTCAR file. |
| more STATES1 | Determine HOMO and LUMO, HOMO is the highest orbital with a 2, LUMO is the first 0. In my case HOMO is 112 and LUMO is 113 |
| NOT SURE HOW HE GENERATED STATES FILE | |
| head STATES | Record the lowest number, in my case it is 81 for DIMER |
| tail STATES | Record the Highest number, in my case it is 160 for DIMER |
| vi input_overlap | |
| i | |
| 1 | |
| 160 | |
| 1 | |
| :wq | |
| cp energy_pop STATES | |
| more ~/bin/ADVICE.spectrum | This will make spectrum. This will show 3 lines of code. Literally copy one line and press enter starting with the “module swap PrgEnv-intel PrgEnv-gnu” |
| module swap PrgEnv-intel PrgEnv-gnu | |
| cp ~/bin/OS/2020/*.exe . | copying templates and inputting them into the directory you are in |
| ./osc_str_CHEM676.exe | This reads binary WAVECAR file, Reads input_overlap, creates Oscillator strength |
| head | This should show a fresh OS_STRENGTH was made |
| grep ‘2.0000 0.0000’ OS_STRENGTH > OS_NEW | In the OS_STRENGTH file we will see lines of no transition from occupied to unnoccupied. What we want to see is the lines that have an occupied originally (2.0000) and then are unoccupied (0.0000). This shows excitation. The lines that meet this requirement are then inputted into OS_NEW |
| head OS_NEW | This should show a range of orbitals that have been occupied and are now unoccupied. With the differing orbitals involved. Columns 1 and 2 are the initial and final orbitals that are involved with the “hopping” of electrons. The 3rd column is oscillator Strength. 4th Column is Transition energy. |
| mv OS_NEW OS_STRENGTH | We don’t need all OS_STRENGTH data, just the stuff we “grepped” in OS_NEW. This overrides OS_STRENGTH with information from OS_NEW. |
| wc OS_STRENGTH | Word count: The 1st number shows number of lines present in file. 2nd number of words present in file. 3rd column shows number of characters present in file. 4th number is the file name which is given as an argument. |
| head –n 30 OS_STRENGTH | In this particular case we only want the top 30 rather than the original value the first column gave was. In my case it was about 1536. |
| sort –gk 4 | To sort in ascending order of transition energy. 4 is the 4th column. I don’t know what –gk means. |
| sort –gk 4 > CANDIDATES | Inputs this information into CANDIDATES file |
| Orbital Visualization | |
| I don’t have all information available here, for example I personally didn’t make the PARCHG files. | |
|
Guidance to make PARCHG files: username@cori11:/global/cfs/cdirs/m1251/vasp/CHEM676/meade/DIMER> mkdir ORBITALS username@cori11:/global/cfs/cdirs/m1251/vasp/CHEM676/meade/DIMER> cp WAVECAR ORBITALS/ username@cori11:/global/cfs/cdirs/m1251/vasp/CHEM676/meade/DIMER> cp CONTCAR ORBITALS/POSCAR username@cori11:/global/cfs/cdirs/m1251/vasp/CHEM676/meade/DIMER> cp POTCAR ORBITALS/ username@cori11:/global/cfs/cdirs/m1251/vasp/CHEM676/meade/DIMER> cp *.sh ORBITALS/ username@cori11:/global/cfs/cdirs/m1251/vasp/CHEM676/meade/DIMER> cp KPOINTS ORBITALS/ > cd ORBITALS/ username@cori11:/global/cfs/cdirs/m1251/vasp/CHEM676/meade/DIMER/ORBITALS> grep NBA ../OUTCAR k-points NKPTS = 1 k-points in BZ NKDIM = 1 number of bands NBANDS= 160 username@cori11:/global/cfs/cdirs/m1251/vasp/CHEM676/meade/DIMER/ORBITALS> cp ~/bin/INCAR/INCAR-pc ./INCAR username@cori11:/global/cfs/cdirs/m1251/vasp/CHEM676/meade/DIMER/ORBITALS> tail INCAR IBRION=2 #conjugate-gradient algorithm used to relax ions (bad NSW=0 #number of ionic steps POTIM= .2 #time step in fs EDIFFG=-0.001 #minimum energy difference between ionic iterations EINT= -4.4 -0.5 EINT= -6 2 LVTOT = .TRUE. username@cori11:/global/cfs/cdirs/m1251/vasp/CHEM676/meade/DIMER/ORBITALS> sbatch cori_debug.sh Submitted batch job 32413471 many thanks for the new version! The main question in your email is orbitals with VASP: a. generate or use premade healthy WAVECAR (it is an analog of .chk in gaussian) b. in a new directory, use template of the INCAR for orbitals and run vasp once again. the templates are named ~/bin/INCAR/INCAR_pc and similar names. (it is an analog of the cubegen procedure in gaussian) c. upon successful run, there appear files nammed PARCHG.XXXX.ALLK, where XXXX stands for the index of orbital, e.g. PARCHG..01112.ALLK (those files are analogs of the .cube files in gaussian. note that vasp DOES not generate literal .cube files!) d. download these files and open then in the VMD - the same software you have used for the trajectories. |
|
| Step 2. Changing PARCHG Files to cube files (For Orbital Visualization) | From what I have seen we need cube files to show in guassview AND VMD |
| Once obtained PARCH.####.ALLK Files then use following command in PHOTON to convert the orbitals you care about to cube! | |
| ~/vtstools/chg2cube.pl filename | |
| 3 | selecting PARCHG |
| 1 6 7 8 | (These are the atomic numbers for the atoms in your system. In my case I have Hydrogen, Nitrogen, Oxygen, and Carbon |
| Your cube file is then generated | |
| SEND cube files, POSCAR (OR CONTCAR), CHGCAR FILES TO DESKTOP | |
| Step 3. Using VMD to generate orbitals | |
| Open VMD | |
|
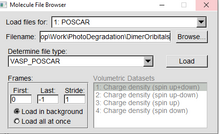
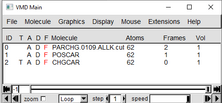
In the VMD Main window go to “File” “new Molecule” Upload your 1.POSCAR (OR POSSIBLY CONTCAR): By selecting VASP_POSCAR under the “Determine file type:” 2. CHGCAR: By selecting VASP_CHGCAR under the “Determine file type:” 3. USE THIS ONE PARCHG: By selecting VASP_PARCHG under the “Determine file type:” (Even though the file ends in .cube we are classifying it as PARCHG) |
|
| |
|
After all three are uploaded, in the VMD Main window go to “Graphics” and then “Representations” |
|
|
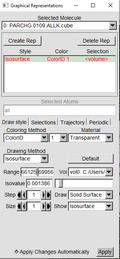
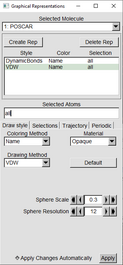
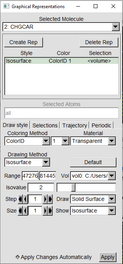
In the Graphical Representations window follow these three examples.
|
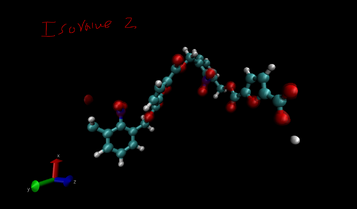
The red lettering means that PARCHG Isosurface isn’t being shown. You can double click on the red lettering to make it black and showing on the OpenGL Display Window. Double click again to revert to black. Parchrg can be shown and can be visualized in conjungtion with the CHGCAR file |
|
|
|
-You can change the iso value in CHGCAR to get varying orbital visualizations. -Play with it. -Change the color by changing the ColorID to different ones. -(Range in CHGCAR doesn’t matter) |
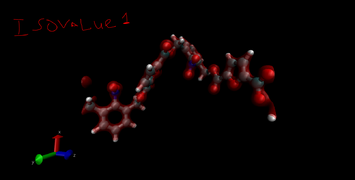
For Monomer Project Show all index 52 47 29 44 38 28 18 56 64 H52 H47 H29 H44 H38 H28 H18 H56 H64 |
|
|
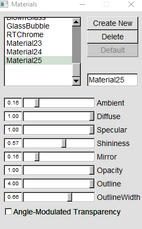
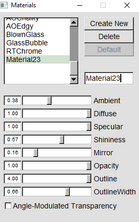
| To get rid of opaque water molecuels make both of these in “Graphics” “Materials” 123 is for faded bods and 124 is for the orbitals | |
|
|
| For my Monomer_H2O first frame hide these atoms if you don’t want in view | |
|
O108 O99 O94 O101 O81 O91 O90 O86 O82 O87 O79
H45 H62 H51 H58 H50 H48 H14 H22 H36 H42 H31 H20 H23 H35 H30 H54 H59 H25 |
all not index ### ### ### ###... all not index 108 99 94 101 81 91 90 86 82 87 79 73 45 62 51 58 50 48 14 22 36 42 31 20 23 35 30 54 59 25
index 97 103 11 9 10 13 12 96 1 84 78 3 4 100 77 0 8 2 5 6 7 |
| These are for the figure first frame for still seeing the water atoms but hazy | |
|
H22 14 26 19 30 35 15 17 60 69 73 62 45 34 40 16 21 37 27 55 53 49 24 32 43 39 33 67 70 71 65 75 76 66 72 68 63 59 50 51 58 54 48 20 47 23 36 42 31 25 74 61 57 41 46
|
22 14 26 19 30 35 15 17 60 69 73 62 45 34 40 16 21 37 27 55 53 49 24 32 43 39 33 67 70 71 65 75 76 66 72 68 63 59 50 51 58 54 48 20 47 23 36 42 31 25 74 61 57 41 46 90 86 91 99 94 104 106 111 109 110 107 92 85 95 102 88 80 89 108 105 83 87 82 81 90 101 79 93 |
| Index for Diagram for pics Middle Frame for H20 molecules | |
|
H63 H33 H17 H21 60 68 42 38 34 50 72 73 16 61 55 71 59 69 40 14 39 74 67 53 49 41 52 27 15 31 23 54 62 32 64 30 26 57 37 51 58 70 43 25 35 46 45 |
O80 87 99 81 88 105 104 91 90 106 97 108 102 89 93 101 92 107 78 109 86 83 94 63 33 17 21 60 68 42 38 34 50 72 73 16 61 55 71 59 69 40 14 39 74 67 53 49 41 52 27 15 31 23 54 62 32 64 30 26 57 37 51 58 70 43 25 35 46 45 80 87 99 81 88 105 104 91 90 106 97 108 102 89 93 101 92 107 78 109 86 83 94 |
| Preparation of TDESMD Orbital Files and Job Submission | |
| mkdir TDESMD_111_114 | We will now use the information of the CANDIDATES file and create new folder for each scenario. You create a file titled using the orbitals involved. In my case the first scenario is with orbitals 111 and 114 |
| cd TDESMD_111_114 | |
| cp /global/cfs/cdirs/m1251/vasp/CHEM676/meade/DIMER/TDESMD_111_114/INCAR_EXCITED | Taking INCAR_EXCITED file from location. In my case it is here. |
| vi INCAR_EXCITED | Edit the INCAR_EXCITED file to make it look like |
| i | 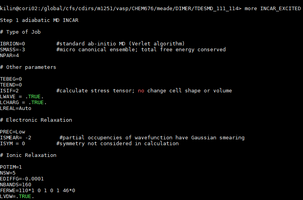 |
|
Change FERWE=#### to match the total number of orbitals/bands. In this example we have a total number of 160 bands/orbitals.
The main thing that is changing is the position of one occupied orbital and one unoccupied orbital when the compound is in ground state. In this example number 111 is usually occupied in ground state and we are moving the electron to 114 which is unoccupied in ground state. | |
| ONE more example is as follows. With TDESMD_102_115 | |
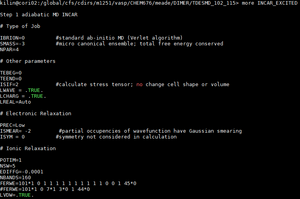
| |
| “esc” key | |
| :wq | |
| cp /global/cfs/cdirs/m1251/vasp/CHEM676/meade/DIMER/POSCAR ./CONTCAR | |
| cp /global/cfs/cdirs/m1251/vasp/CHEM676/meade/DIMER/KPOINTS | |
| cp /global/cfs/cdirs/m1251/vasp/CHEM676/meade/DIMER/POTCAR | |
| cp /global/cfs/cdirs/m1251/vasp/CHEM676/meade/DIMER/TDESMD_111_114/debug1.sh | |
| sbatch debug1.sh | |
| Creating Videos from movieAll.xyz files and uploading them on youtube | |
| scp –r TDESMD_###_### DestinationUser:/DestinationLocation |
Starting in cori
|
|
--OPEN A NEW TAB IN MOBA XTERM--
|
|
| Without logging into the account you should be able to see if you are on your current computer | |
| ls | make sure you are in your computer directory. Usually you will see “DESKTOP” as an option |
| cd DESKTOP | |
| mkdir TDESMD_###_### |
In DESKTOP
|
| scp username@photon.chem.ndsu.nodak.edu:/scratch001/Chem_476/CHEM676_2019/Meade/DIMER/TDESMD_##_###/movieALL.xyz . | WHILE IN THE TDESMD DIRECTORY THAT YOU WANT TO BE THE DESTINATION take “movieALL.xyz” from photon and put into specific directory |
| Once the file is in your desktop you can go to your windows folders and open it to check if it is there. | |
| In windows search bar | |
| VMD |
type vmd in windows search bar and open it.
|
| We will focus on this screen first to open all the extra screens we need. (VMD Main) | 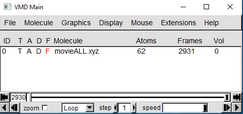
|
| Press “File”, “New Molecule,” | |
| On the window that comes up (Molecule File Browser) Press “Browse” and find the file you would like. Find the file you want. In this example it is an xyz file. | |
| Once A file is picked then press “Load” in the Molecule File Browser window. | |
| Going back to VMD Main | |
|
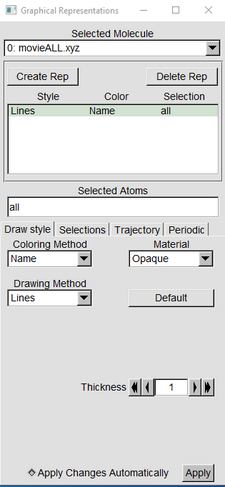
Press “Graphics” and Representations to open a long slender screen.(VMD Main) |
|
| Press the “Create Rep” Button (Graphical Representation window) | |
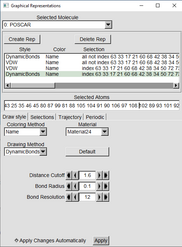
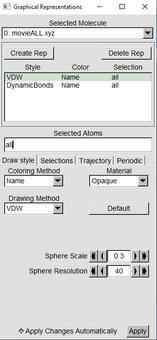
| With one of the “Reps” highlighted in green, in the drawing Method switch from Lines to VDW | |
|
Change the Sphere scale to 0.2. Resolution can stay at default or can be raised if desired. |
|
|
Click on the other line that still says “LINES” and in the Drawing Method change it to Dynamic Bonds Change Distance Cutoff to 1.6 Bond Radius to 0.1 And Resolution can stay at default or be increased |
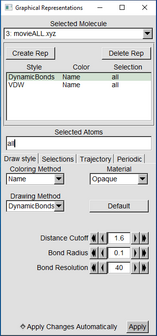
|
| Go back to VMD Main | |
| Go to “Extensions,” “Visualizations,” and “Movie maker” | |
| Go to the VMD Movie Generator window | |
| In the box of “Name of movie” type the TDESMD_##_### you have. | 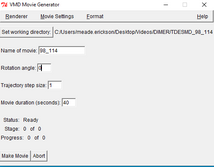
|
| “Set Working Directory“ choose the destination directory you want the movie to go to. | |
| “Rotation Angle” I put it to 0 but you can put it to whatever. | |
| “trajectory step size” 1 | |
| “Movie Duration” This depends on your frames from the (VMDMain) Usually 1000 frames is about 20-30 seconds if the speed (step) is set to 1. But By changing the speed of the video we should make the total video length to 30-45 seconds long. | 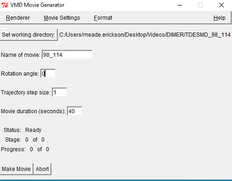
|
| Back to VMD Main window | |
| Press “Mouse,” “Label,” “Bonds” | |
| click on two neighboring atoms to get the atom name and bond length | |
|
IN VMD Main, go to “Graphics” and “Labels.” select “atoms” in the drop down menu on the “Labels” window. Select all atoms by clicking on the top atom and then “SHIFT+left click” the bottom atom to select all atoms
|
|
|
While all atoms are selected (highlighted in green). Go to “Properties” and in the “Format” box type %e%i. (The %e gives the element and the %i gives the index number) Some information can be presented by simply having your cursor over the %e%i and a yellow box will pop up for some info. You can move the lettering of each atom by moving the offset information. |
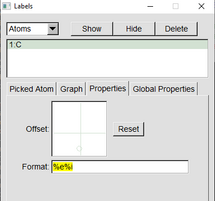
|
Click the global properties and change text size and text thickness. ( all of this can be see in the (VMD1.9.3 OpenGL Display) 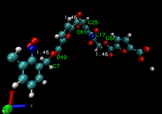
|
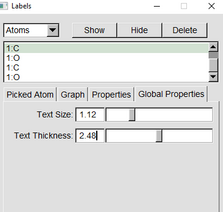
|
| in VMD movie Generator press “make movie” and quickly in VMD main press the play button. | |
|
Once the video is done a popup should be produced asking where to find videomach. Here is the directory for my computer. C:\Program Files (x86)\VideoMach\videomach.exe
|
|
| Once you put in the file videomach.exe then videomach should show up. | |
| Switch the file type to MP4 | |
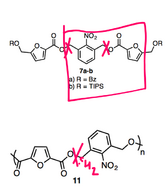
| |
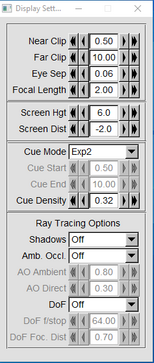
| |
| Polymer/Monomer Photodegradation: TDESMD 91 121 Bond Data | |
| Obtaining MASSPECTRUM Data from FERWE TDESMD Calculations | |
| We will be using python scripts that are premade. In PHOTON | |
| go to the TDESMD_###_### directory you want to go to | |
| in here make another directory called massspectrum | |
| mkdir massspectrum | |
| cd masssspectrum | |
| cp /Location/movieALL.xyz | This should be from the TDESMD_###_### you are in. |
| cp /Location/script1n.py | /scratch001/Chem_476/CHEM676_2019/Meade/Pythonscript/script1n.py |
| babel –ixyz movieALL.xyz shot.xyz -m |
Creating shot files. Each shot is a “frame” from the video.
-2055 files output. The first is shot1.xyz |
| python3 script1n.py | |
| enter number of molecules converted | |
| a frequency file should be created | |
| cp frequency.txt frequency1.txt | |
| awk 'ORS=(!(NR%2)?"\n":" ")' RS=" " frequency.txt > file1.txt | |
| cp rmovingfile.sh | /scratch001/Chem_476/CHEM676_2019/Meade/DIMER/TDESMD_112_116/massspectrum/MultipleCellMassSpec |
| bash rmovingfile.sh | |
| vi file1.txt | Edit the file by deleting everything that doesn’t relate to the numbers. |
| i | |
before 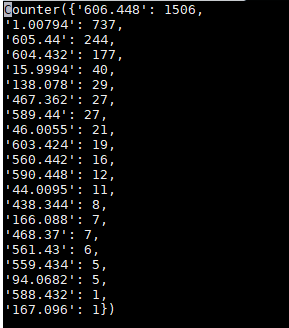
|
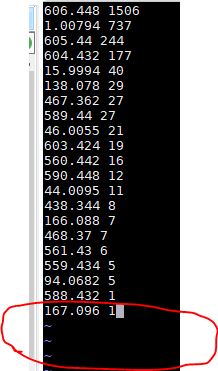
after |
|
IT IS NECESSARY TO MENTION THAT WHEN CREATING THE FRAGMENTS FILE AN EXTRA BLANK LINE WILL BE GENERATED. IT IS ESSENTIAL TO DELETE. |
|
| “esc” key | |
| :wq | |
| cp file1.txt fragments | |
| wc fragments |
record the first number
|
| ~/bin/DRESS_FRAGMENT_v2 | |
|
21 100 300 .1 1 62 160
|
number of states Min MASS (can change if desired) Max MASS (can change if desired) width of the line used magnitude (keep at one) number of atoms number of electrons |
| Plotting FERWE MASSPECTRUM | |
| gnuplot | |
| set style line 4 lw 100 lc -1; unset key; plot "MASS_SPEC.norm" using 3:5 w l lw 3; set xlabel 'Molecular Weight, amu' font ",30" offset 0,-2,0; set ylabel 'Intensity (a.u)' font ",30" offset -1,0,0; set title "Mass Spectrum Dimer Multiple Cells" font ",30" offset 0,0.5,0; set tics font ",30"; set ytics offset 0,0,0; set xtics offset -0.4,-1,0 | e in the directory of the file you want to plot, in this example we are using MASS_SPEC.norm as our file with the data we want. |
|
set style line 4 lw 100 lc -1; unset key; plot "MASS_SPEC.norm" using 3:5 w l lw 3; set xlabel 'Molecular Weight, amu' font ",30" offset 0,-2,0; set ylabel 'Intensity (a.u)' font ",30" offset -1,0,0; set title "Mass Spectrum Monomer H2O Multiple Cells" font ",30" offset 0,0.5,0; set tics font ",30"; set ytics offset 0,0,0; set xtics offset -0.4,-1,0;
|
monomer h20 |
| ressing p takes you to the previous zoom level, n to the next level, and u unzooms | |
| set style line 4 lw 100 lc -1; unset key; plot "MASS_SPEC.norm" using 3:5 w l lw 3; set xlabel 'Molecular Weight, amu' font ",30" offset 0,-2,0; set ylabel 'Intensity' font ",30" offset -1,0,0; set title "Mass Spectrum Dimer Multiple Cells" font ",30" offset 0,0.5,0; set tics font ",30"; set ytics offset 0,0,0; set xtics offset -0.4,-1,0 | |
| Obtaining Multiple Cell MASSPECTRUM Data from FERWE TDESMD Calculations | |
| Make sure TDESMD CONTCAREXICTED and CONTCARGROUND files have been generated. Start in Cori go to Photon | |
|
cp /global/cfs/cdirs/m1251/vasp/CHEM676/meade/DIMER/TDESMD_112_116/massspec/MultipleCellMassSpec/test.sh cp /global/cfs/cdirs/m1251/vasp/CHEM676/meade/DIMER/TDESMD_112_116/massspec/MultipleCellMassSpec/ test_o.sh cp /global/cfs/cdirs/m1251/vasp/CHEM676/meade/DIMER/TDESMD_112_116/massspec/MultipleCellMassSpec/ANA_v2.exe cp /global/cfs/cdirs/m1251/vasp/CHEM676/meade/DIMER/TDESMD_112_116/massspec/MultipleCellMassSpec/input_ANA cp /global/cfs/cdirs/m1251/vasp/CHEM676/meade/DIMER/TDESMD_112_116/CONTCAREXICTED and GROUNDFILES |
Take these files from Cori and put them into photon. These two files are needed for running the scripts properly These are the “important parts of the code” ~/vtstools3/pos2xyz.pl CONTCAR cp CONTCAR.xyz INPUT.xyz ~/bin/ANA_v2.exe cat OUTPUT.xyz > movieANA.xyz input_ANA should have similar format to this Where the first 3 numbers are from POSCAR, the last 3 are the number of cells in the x,y,z axes respectively. This files was duplicated across Z axis. 18.54438999999999 14.45937999999995 17.76793999999994 1 1 10 |
|
~/vtstools3/pos2xyz.pl CONTCAR cp CONTCAR.xyz INPUT.xyz ~/bin/ANA_v2.exe cat OUTPUT.xyz > movieANA.xyz |
Delete movieANA.xyz if you have it already. ( This is to make sure the OUTPUT and initial part of the moveANA.xyz file is what it needs to be. In my situation I wanted to have 10 cells combined together. I used input_ANA |
|
CHECK to see if OUTPUT has the correct number of atoms |
Single cell had 620 atoms, I multipled it by 10 since I wanted to duplicate 10 times. If this is good procede to next steps |
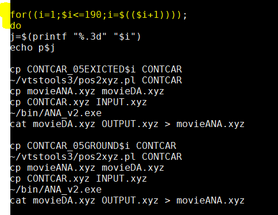
| vi test.sh | |
|
change the number to later stage in your trajectory(or the number where you think degradation had occurred. For example my total CONTCARGround and excited was about 191 files. I saw degradation occur later in the simulation so I chose the number 190. This changes with the simulations. |
| bash test.sh | this runs the test.sh file |
| bash test_o.sh | |
| NOW LOOKING INTO PHOTON | |
| cp all files into photon directory | |
| cp /Location/script1n.py | /scratch001/Chem_476/CHEM676_2019/Meade/Pythonscript/script1n.py |
| babel –ixyz movieANA.xyz shot.xyz -m |
Creating shot files. Each shot is a “frame” from the video. Record number of molecules converted. -2055 molecules converted -2055 files output. The first is shot1.xyz |
| Follow regular mass spec steps from above. Rather than using MovieALL we are using movieANA.xyz. | |
|
photon /scratch001/Chem_476/CHEM676_2019/Meade/DIMER/TDESMD_112_116/massspectrum/MultipleCellMassSpec cori /global/cfs/cdirs/m1251/vasp/CHEM676/meade/DIMER/TDESMD_112_116/massspec/MultipleCellMassSpec/test | |
| plummer code for renaming files | /global/project/projectdirs/m1251/vasp/CHEM676/meade/MONOMER_H2O/TDESMD_162_167/massspec/multiplemassspectest/plumoutput |
| How to read/get the fragments with their xyz coordinates | |
|
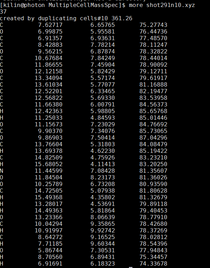
Go into the directory with the shot files with the multiple cells. Make sure that some files have this comment inside of them by opening a shot file that has name shot##n#.xyz The comment should be. created by duplicating cells# |
|
| grep -E 'created by duplicating cells.* 17.' shot* |
finds lines that have both “created by duplicating cells” and the number 17 in the same line. 17 is the mass number we are looking for I am unsure what the “.*” does in this code make sure there is a space between the * and the 17 |
| Then open one of the xyz files listed. | |
| Literally drag and copy the file information into a notepad document in your desktop. | |
| more shot291n10.xyz | |
|
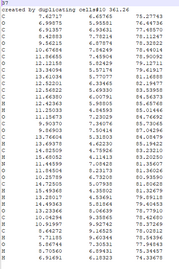
|
| open the xyz file in Avogadro and save as mol file. | |
| the Avogadro file is correct visualization of the fragments. Mol file will have some defects so you will have to change those. | |
| Making Video from output of VASP | |
|
~/vtstools3/pos2xyz.pl CONTCAR cp CONTCAR.xyz INPUT.xyz ~/bin/ANA_v2.exemore cat OUTPUT.xyz > movieANA.xyz
|
Delete movieANA.xyz if you have it already. ( This is to make sure the OUTPUT and initial part of the moveANA.xyz file is what it needs to be. In my situation I wanted to have 10 cells combined together. I used input_ANA |
| LAAMPS | |
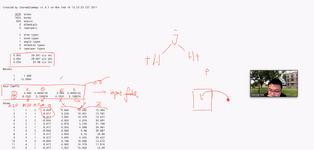
|
testwater file: Epsolon is Inputs from something like DFT
Atom ID Molecule ID Atom Type Q - charge X Y Z |

|
This infor can be put in input script if desired. |

|
bond id bond tuype atom id that connects atom id that connects as well |

|
Angle ID Angle Type 1 being single bond 2 being double, etc Item ID such as first atom O , 2nd and 3rd atom H |
| qsub submit.sh | submits the job using submit.sh |
| qstat -u meade.erickson | shoes me my jobs |
| chmod -777 lmp_mpi_12Dec18 | modifies permission for this file |
| [meade.erickson@login0002 testwater]$ chmod -777 ~/bin/lmp_mpi_12Dec18 | giving permission while in a different |
| topo readlammpsdata project.data | reads data file for vmd tk console |
| Inputting files, put in .dcd file then right click on it and “Load Data into Molecule” then select .data file. | |
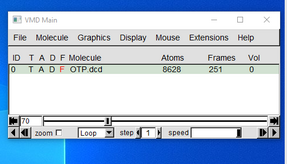
|
|
| module avail | Available software in ccast |
| qdet job id | qdel ###### |
| fragment 0 to 9 or fragment 14 |
